
Stop Using console.log() for Debugging , Do This Instead!
 for Debugging , Do This Instead!")
Debugging with console.log() may appear simple and familiar, but it is inefficient and has limited capability. Instead of relying on console.log(), it’s time to stop using console.log() for debugging. Do this instead! Modern tools, such as Chrome DevTools, offer much better options for identifying and resolving errors in your code.
Stop using Console.log for debugging Here’s What to Do Instead
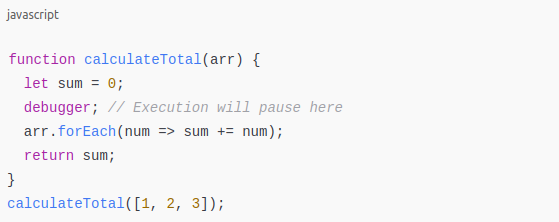
1. Use the debugger Statement
- How It Works: Insert a debugger; into your code, and when DevTools is launched, the code will halt at this line.
Why It’s Better
- Allows for live inspection of variables, scopes, and call stacks.
- Allows you to move through the code to learn how it flows dynamically.
Example
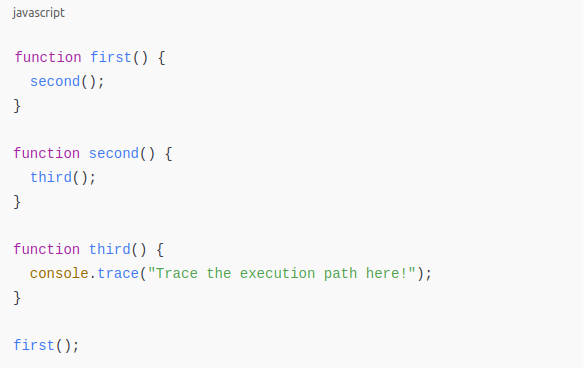
2. Replace console.log() with console.trace()
- What It Does: Prints a thorough stack trace indicating how a certain point in your code got reached.
Related topics you may enjoy: How to Use Triggers in my SQL?
Why It’s Useful
- Traces function calls without overloading your code with logs.
- Quickly determines where and why specific functions are called.
Example
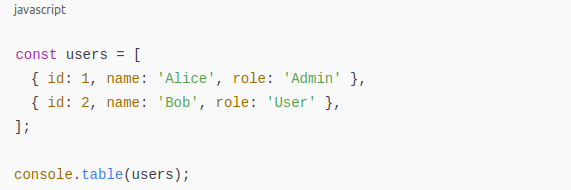
Use console.table() for Readable Data
- What It Does: Displays arrays and objects in a tabular representation for easy analysis.
Why It’s Useful
- Facilitates debugging of structured data.
- Eliminates the need for additional consoles.Log() is used to examine nested properties.
Example
Set Breakpoints in DevTools
- How It Works: Add breakpoints directly in the Sources tab in DevTools by clicking on the line number.
Why It’s Powerful
- Allows precise pausing without altering code.
- Offers tools to monitor variable changes, evaluate expressions, and control execution flow.
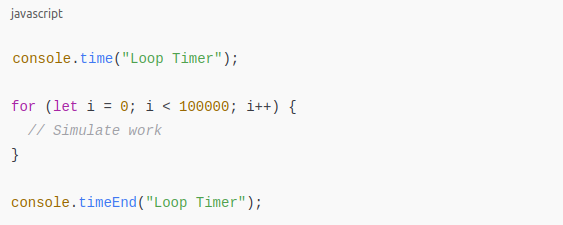
Measure Performance with the console.time()
- What It Does: Measures how long a particular operation or block of code takes to execute.
Why It’s Useful
- Identifies performance bottlenecks.
- Helps you optimize code efficiency.
Example
Pro Tips
- Clean Up Before Deployment: Remove any console.log() statements before sending code to production. To enforce this requirement, use a linter or continuous integration tools.
- Error Tracking Tools: Automate error recording and debugging in production scenarios using services such as Sentry or LogRocket.
- Advanced Debugging: Use conditional breakpoints and watch expressions in DevTools to speed up debugging for complicated scenarios.
Conclusion
While console.log() is useful for fast checks, relying on it reduces debugging efficiency and code readability. To get more control and visibility into your code, use sophisticated tools like as the debugger, console.trace(), and DevTools breakpoints. These strategies improve your debugging abilities and save time, making your development workflow more efficient and professional.
Say goodbye to console.log("Why isn't this working???") and hello to a more efficient debugging strategy!